In our experience, clients will assess a wealth manager on the quality of advice, service levels and investment performance. So we’re proud to deliver a friendly, tailored approach and a robust, well-resourced investment process, which consistently delivers a competitive return for our clients.
We are committed to complete transparency and proudly display the full performance history of all managed portfolios (since they were established). We aim to ensure that, after costs, each discretionary portfolio outperforms the market every calendar year. The graph below shows both the portfolio performance and the corresponding market benchmark. We believe this benchmarking is important because it allows you to measure the degree to which our advice and expertise have added value to an investment’s performance.
To see a performance graph, click on the cross or heading.
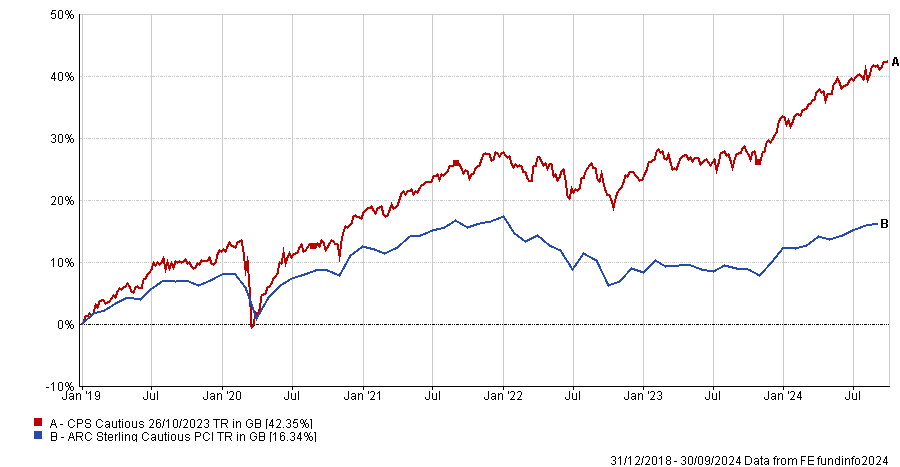
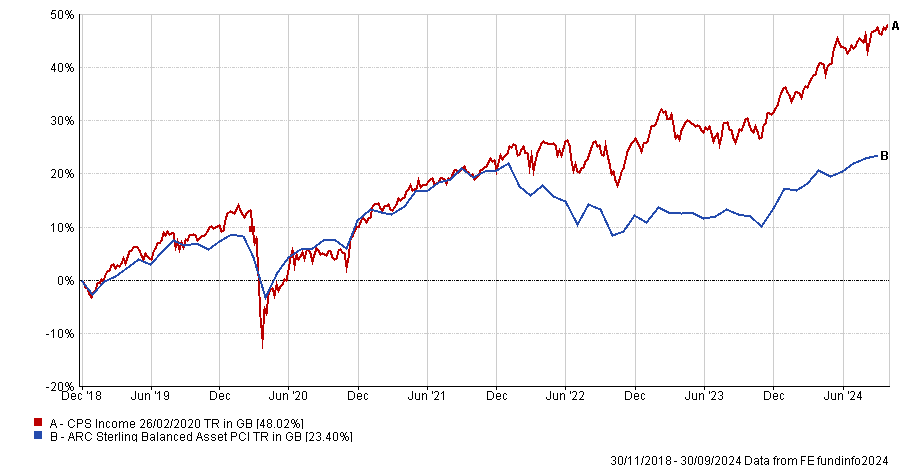
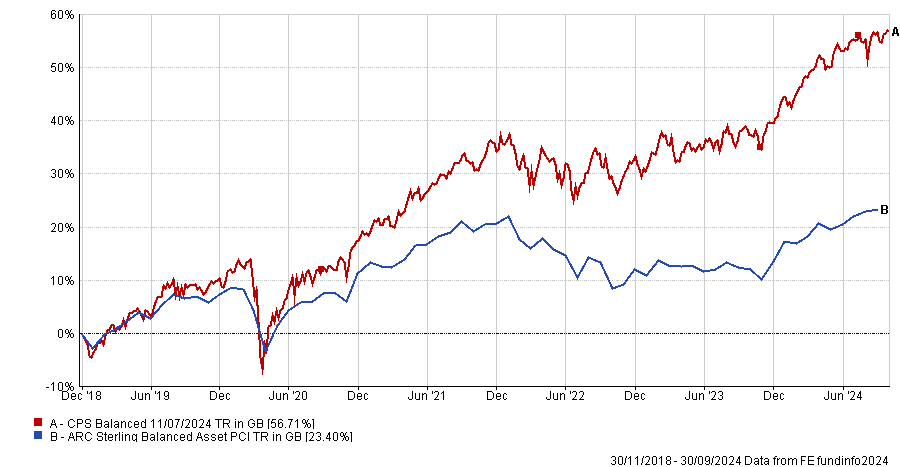
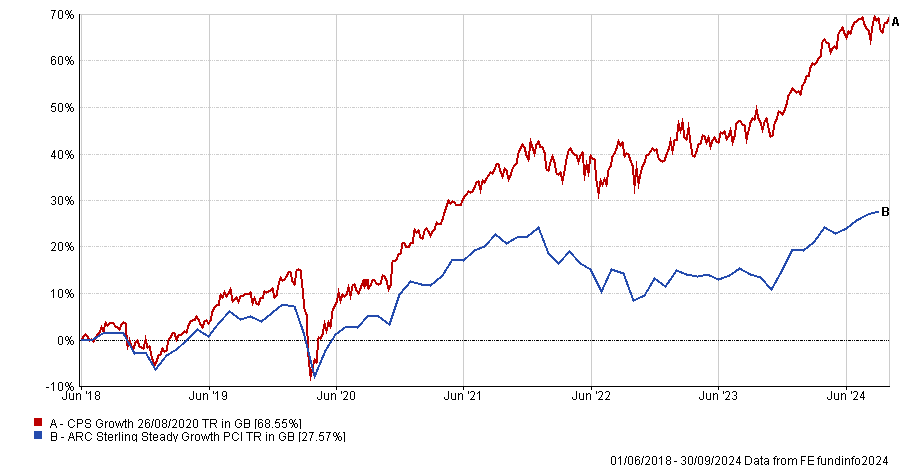
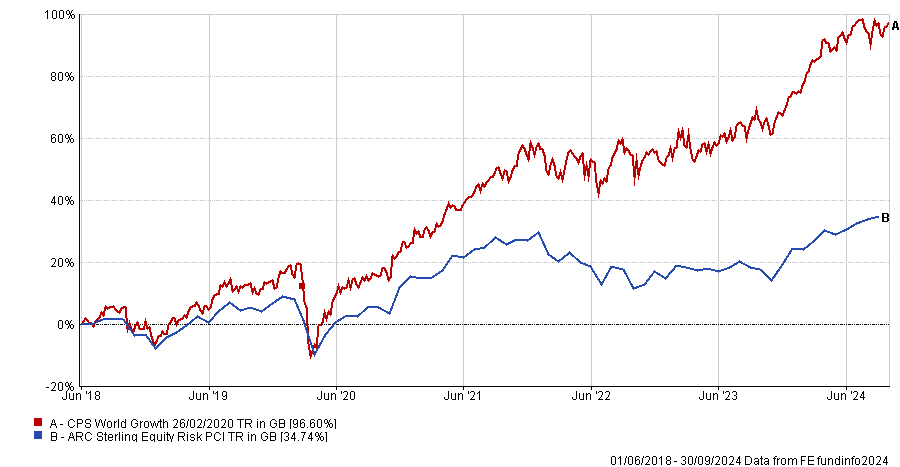
Please note, past performance is no guarantee of future returns, your investment and any income may rise or fall and you could get back less than you invested. Nothing seen on this page constitutes investment advice. If you would like independent advice, please contact us. The charts show performance since inception and include fund costs, but exclude fees for custody and advice.


